
How to Monitor Python GraphQL API With Sentry

As engineering teams are adopting CI/CD practices, software products are getting delivered faster than ever. Error monitoring comes in handy as it provides developers the confidence to deploy faster while knowing there’s a safety net watching their deployments.
On top of that, having error monitoring helps developers to fix and debug errors faster, in order words, developers can spend more quality time building new high-quality features.
The goal of this post is to document and share some of the issues and tips that I have learned while I was working on setting up Sentry monitoring with Django Graphene projects.
TL;DR
How to:
- Hide
Traceback (most recent call last)logger errors - Log Sentry errors with Django Graphene using middleware
- Monitor your GraphQL query performance on Sentry
- Log each GraphQL operation correctly on Sentry
Getting Started With Django
For starters, you can easily set up your Django projects with Sentry by following the official documentation here.
Here’s an example of a settings.py with Sentry SDK:
import sentry_sdk
from sentry_sdk.integrations.django import DjangoIntegration
from sentry_sdk.integrations.logging import ignore_logger


dsn=YOUR_SENTRY_PROJECT_DSN,
    integrations=[DjangoIntegration()],
    traces_sample_rate=1.0,
    send_default_pii=True,
    environment=YOUR_PROJECT_ENVIRONMENT,
)
settings.py
Check out Sentry’s documentation to understand what these configuration options mean.
Traceback Error Spams
Problem
As I was using the default setup while working with Graphene, I ran into issues where my Django Graphene project was getting spammed with this Sentry issue:

Traceback (most recent call last) errorLooking from the Sentry issue, as this error message isn’t particularly meaningful, nor actionable — which can cause error fatigue in the long run, we chose to ignore it.
Solution
In order to get around this, simply ignore this by using ignore_logger from sentry_sdk .
In this case, we would be ignoring the graphql.execution.utils , which is the source of the Traceback errors.
from sentry_sdk.integrations.logging import ignore_logger

ignore_logger('graphql.execution.utils')
You can easily ignore other loggers with this method too!
Error Monitoring
Problem
As we try to forward exceptions to Sentry, there was an apparent issue where Graphene Django would swallow everything, especially after ignoring the graphql.execution.utils logger.
Solution
One of the recommended solutions here is to use create and use middleware inside your Graphene settings.
Start by creating a simple SentryMiddeware to capture all the exceptions thrown.
class SentryMiddleware(object):
    def on_error(self, error):
        capture_exception(error)
        raise error
    def resolve(self, next, root, info: ResolveInfo, **args):
        return next(root, info, **args).catch(self.on_error)
middlewares.py
Next, simply add the newly created SentryMiddleware to your GRAPHENE setting inside your settings.py .
GRAPHENE = {
    'SCHEMA': 'project.schema.schema',
    'SCHEMA_OUTPUT': 'schema.graphql',
    'MIDDLEWARE': [
        # ...
        'django_graphene_starter.middlewares.SentryMiddleware',
    ],
}
settings.py

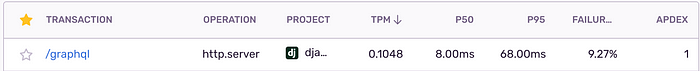
While this is much better than just Traceback error, the operation name /graphql is still rather inaccurate.
Ideally, this should be named as the operation name of your GraphQL query or mutation, i.e. updateArticle , createPublication etc. We will work on naming each query and mutation correctly next.
Performance Monitoring
Besides error monitoring, Sentry is able to track your software performance by measuring metrics such as throughput and latency. Here’s the official documentation to set up performance monitoring for your Django project.
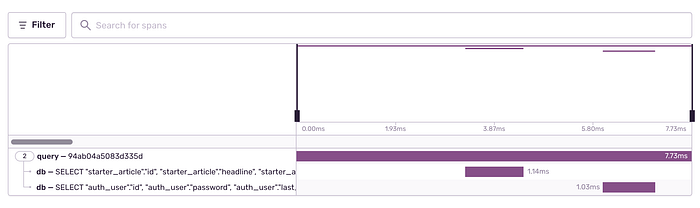
To set this up with your Django Graphene project, you would need to create a custom GraphQLView.
from sentry_sdk.api import start_transaction
from graphene_django.views import GraphQLView


class CustomGraphQLView(GraphQLView):
    def execute_graphql_request(
        self,
        request: HttpRequest,
        data,
        query,
        variables,
        operation_name,
        show_graphiql,
    ):
        with start_transaction():
            return super().execute_graphql_request(request, data, query, variables, operation_name, show_graphiql)
views.py
Problem
From the code snippet above, each of your GraphQL requests will now be logged under the performance tab on Sentry. Though now we have another problem — all our transactions are being named as /graphql , while the operation is always http.server
We don’t have a clear idea of what we’re looking at or what we’re tracking.
Solution
Let’s get the operation type and operation name from Graphene.
class CustomGraphQLView(GraphQLView):
    def execute_graphql_request(
        self,
        request: HttpRequest,
        data,
        query,
        variables,
        operation_name,
        show_graphiql,
    ):
        operation_type = (
            self.get_backend(request)
            .document_from_string(self.schema, query)
            .get_operation_type(operation_name)
        )
        with start_transaction(op=operation_type, name=operation_name):
            return super().execute_graphql_request(
                request, data, query, variables, operation_name, show_graphiql
            )
views.py
Let’s run our GraphQL query/mutation again:
mutation updatePublication($input: UpdatePublicationInput!) { # NOTE
  updatePublication(input: $input) {
    publication {
      id
      title
    }
  }
}

# NOTE: We need to make sure that we name this mutation accordingly

Closing Remark
Error monitoring improves your applications’ health by providing useful insights into the stability of your software.
On top of that, developers can use these insights for addressing existing technical debts and make better decisions around building new features versus fixing bugs.
I had a lot of fun integrating Sentry with my Django Graphene project, feel free to look at my public project on GitHub as a reference. Thanks for reading!